Passionate Data Scientist
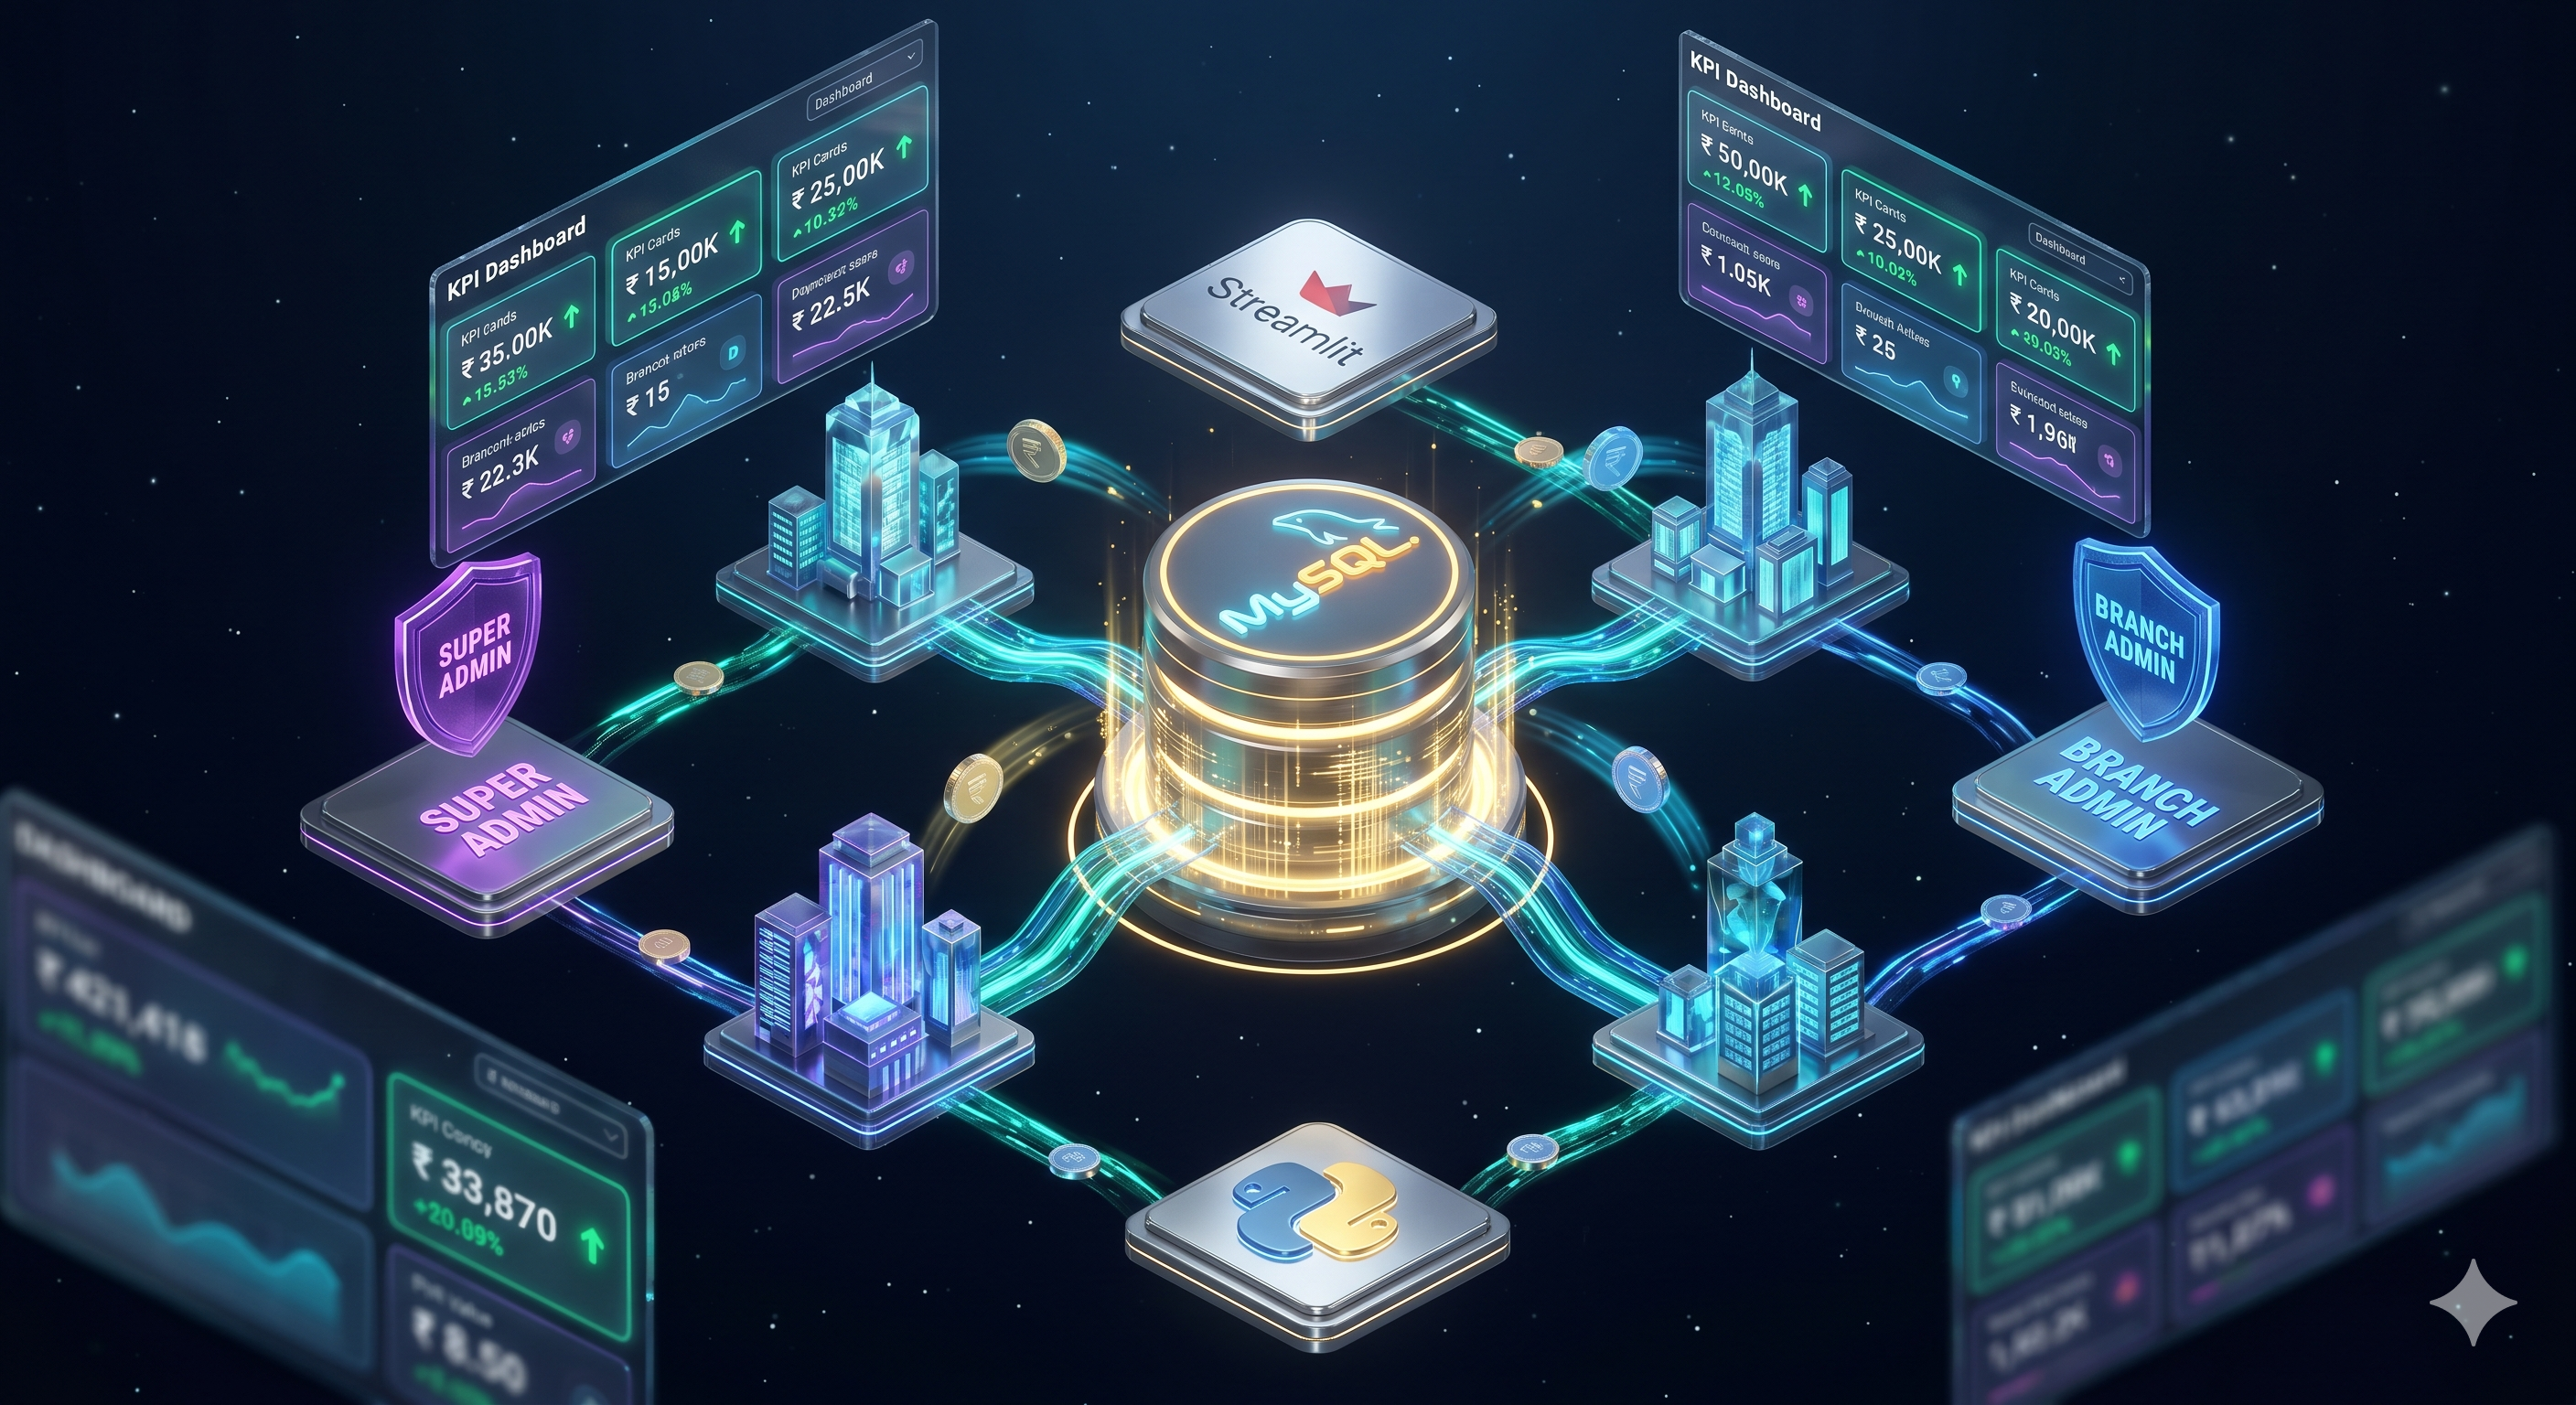
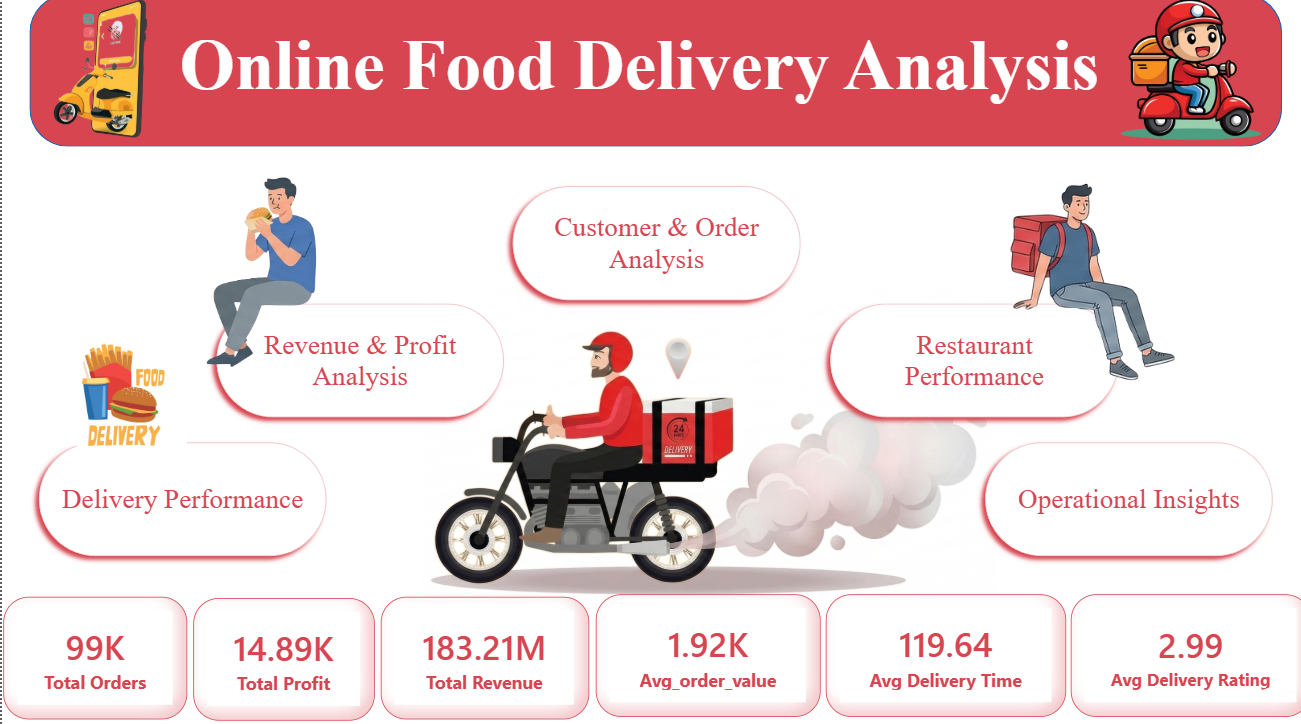
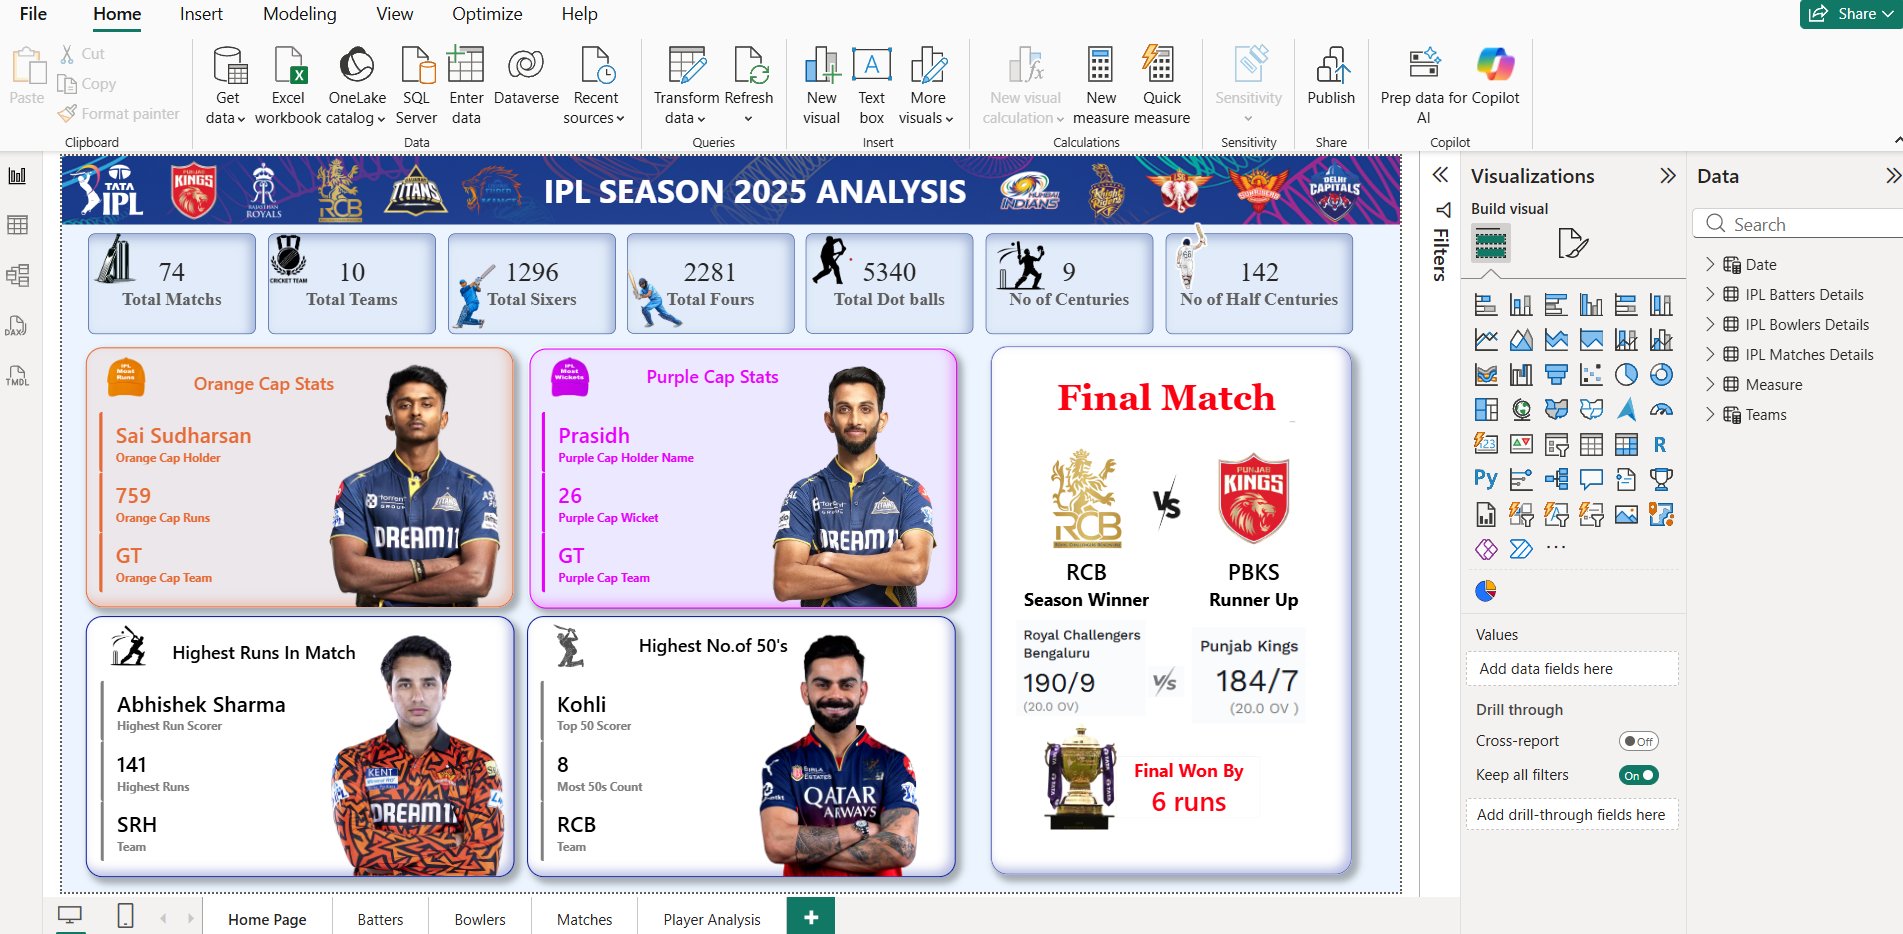
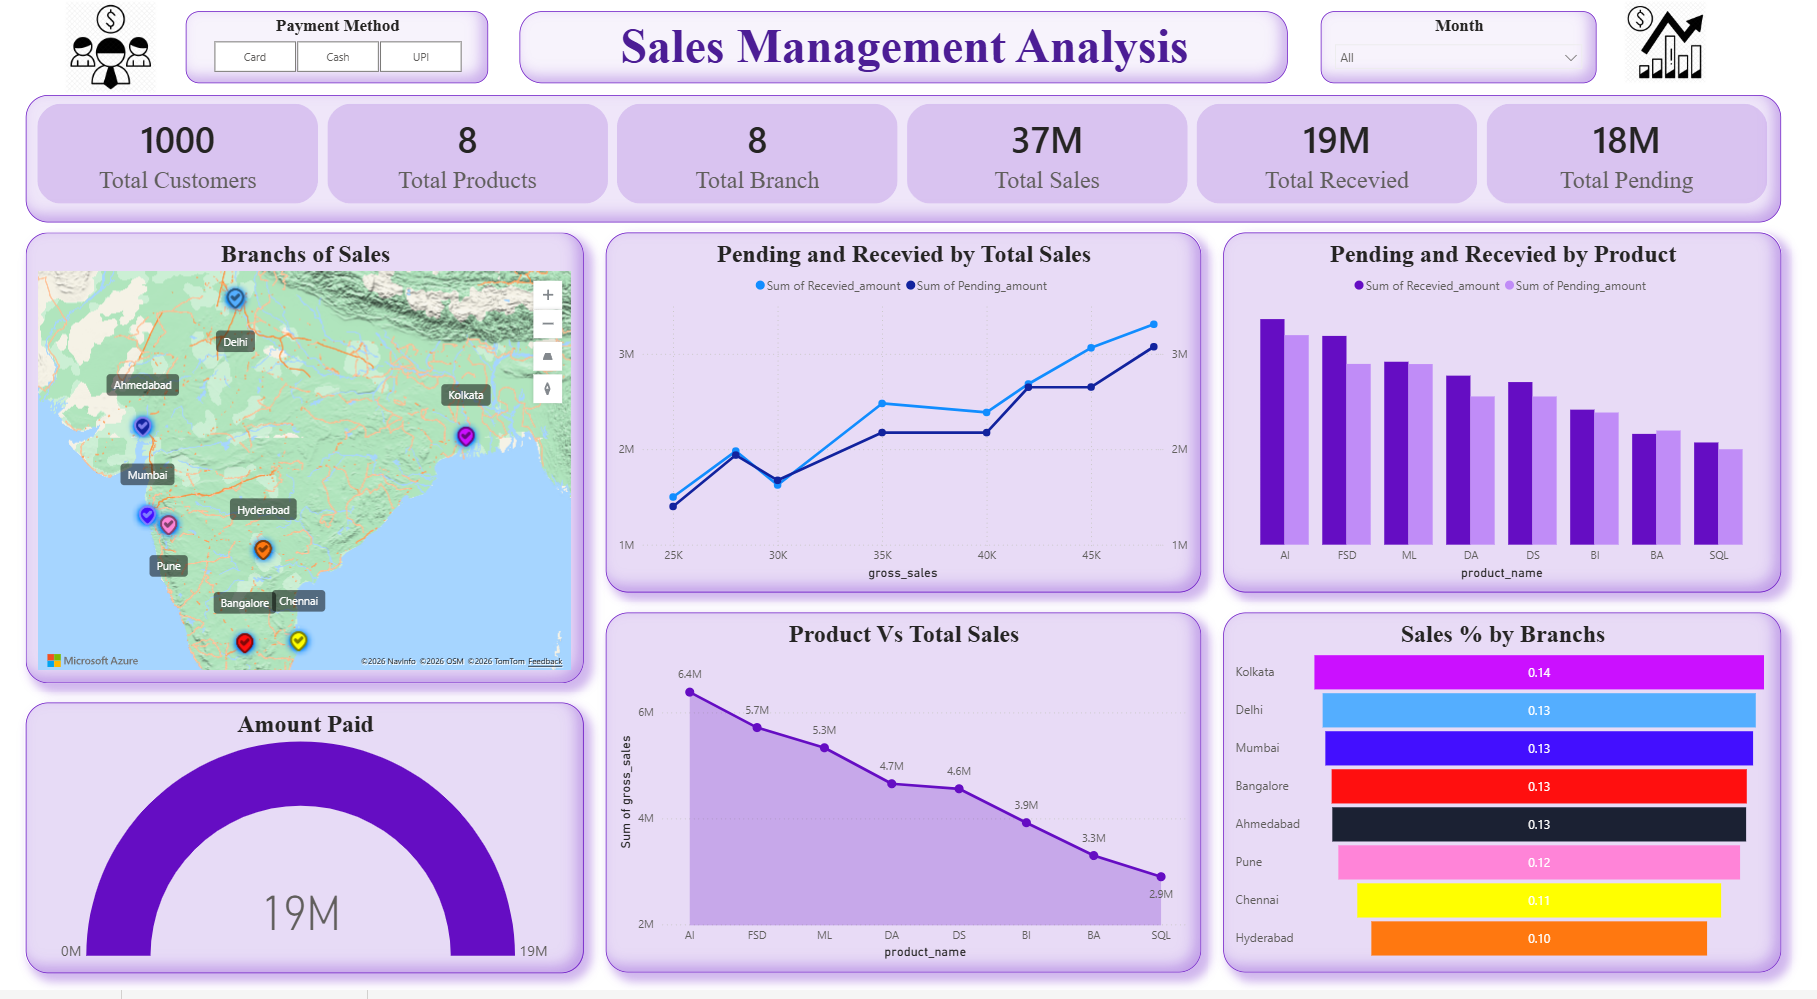
I'm Saran, an Electrical & Electronics Engineering graduate who transitioned into Data Science with a passion for building intelligent, data-driven solutions. Through continuous learning and hands-on experience, I've developed expertise in Python, SQL, Machine Learning, Deep Learning, Natural Language Processing, Computer Vision, Data Analytics, Power BI, Streamlit, and AWS, completing 10+ end-to-end AI and analytics projects using real-world datasets.
I'm passionate about solving complex problems through data and continuously exploring new AI technologies. As an aspiring Data Scientist and Data Analyst, I'm excited to contribute to innovative teams and create solutions that make a measurable impact.
Let’s connect and create impactful solutions together!
Let's Connect